When debugging or profiling with ZendStudio, you quickly hit limits. For example, when profiling the category page of a Magento shop.
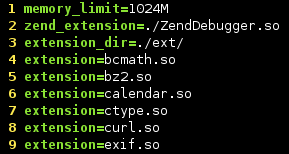
Anyone who has problems here too and can spare a little RAM on their computer for PHP should adjust the debugger's php.ini. You will find it in the directory
"./plugins/org.zend.php.debug.debugger.linux.x86_64_5.3.7.v20091116/resources/php5/php.ini" in the Studio installation (in my case, the current version 7.1.1).
Simply set memory_limit there.
For example:
memory_limit=1024M
Then "quickly" restart ZendStudio.
And the debugger should be debugging again.